HOME - arts humanities - automotive - business - Forex Trading Software - NEWS FOREX - news media - shopping - sports - Technology
Showing posts with label Forex Trading Software. Show all posts
| 0 التعليقات ]

20 Rules For Effective Trade Execution 


Execution can be the weakest link in an otherwise great market strategy. After all, it's a lot easier to find good stocks than to trade them for a profit. So how do we enter the market at just the right time and capture the big moves we see on our charts?

Here are 20 rules for effective trade execution. Try these out the next time you're getting ready to pull the trigger.

1. Seek favorable conditions for trade entry, or stay out of the market until they appear. Bad execution ruins a perfect setup.

2. Watch the tape before you trade. Look for evidence to confirm your opinion. Time, crowd and trend must support the reversal, breakout or fade you're expecting to happen.

3. Choose to execute or to stand aside. Staying out of the market is an aggressive way to trade. All opportunities carry risk, and even perfect setups lead to very bad positions.

4. Filter the trade through your personal plan. Ditch it if it doesn't meet your risk tolerance.

5. Stay on the sidelines and wait for the opportunity to develop. There's a perfect moment you're trying to trade.

6. Decide how long you want to be in the market before you execute. Don't daytrade an investment or invest in a swing trade.

7. Take positions with the market flow, not against it. It's more fun to surf the waves than to get eaten by the sharks.

8. Avoid the open. They see you coming, sucker.

9. Stand apart from the crowd. Its emotions often signal opportunity in the opposite direction. Profit rarely follows the herd.

10. Maintain an open mind and let the market show its hand before you trade it.

11. Keep your hands off the keyboard until you're ready to act. Don't trust your fingers until they move faster than your brain, but still hit the right notes.

12. Stand aside when confusion reigns and the crowd lacks direction.

13. Take overnight positions before trading the intraday markets. Longer holding periods reduce the risk of a bad execution.

14. Lower your position size until you show a track record. Work methodically through each analysis, and never be in a hurry.

15. Trade a swing strategy in range-bound markets and a momentum strategy in trending markets.

16. An excellent entry on a mediocre position makes more money than a bad entry on a good position.

17. Step in front of the crowd on pullbacks and stand behind them on breakouts. Be ready to move against them when conditions favor a reversal.

18. Find the breaking point where the crowd will lose control, give up or show exuberance. Then execute the trade just before they do.

19. Use market orders to get in fast when you can watch the market. Place limit orders when you have a life outside of the markets.

20. Focus on execution, not technology. Fast terminals make a good trader better, but they won't help a loser. 

http://jodnet.blogspot.com
read moor ,,,

| 0 التعليقات ]

20 Rules To Stop Losing Money 


1. Don't trust others opinions -
It's your money at stake, not theirs. Do your own analysis, regardless of the information source.

2. Don't believe in a company -
Trading is not investment. Remember the numbers and forget the press releases. Leave the American Dream to Peter Lynch.

3. Don't break your rules -
You made them for tough situations, just like the one you're probably in right now.

4. Don't try to get even -
Trading is never a game of catch-up. Every position must stand on its merits. Take your loss with composure, and take the next trade with absolute discipline.

5. Don't trade over your head -
If your last name isn't Buffett or Cramer, don't trade like them. Concentrate on playing the game well, and don't worry about making money.

6. Don't seek the Holy Grail -
There is no secret trading formula, other than solid risk management. So stop looking for it.

7. Don't forget your discipline -
Learning the basics is easy. Most traders fail due to a lack of discipline, not a lack of knowledge.

8. Don't chase the crowd -
Listen to the beat of your own drummer. By the time the crowd acts, you're probably too late�or too early.

9. Don't trade the obvious -
The prettiest patterns set up the most painful losses. If it looks too good to be true, it probably is.

10. Don't ignore the warning signs -
Big losses rarely come without warning. Don't wait for a lifeboat to abandon a sinking ship.

11. Don't count your chickens -
Profits aren't booked until the trade is closed. The market gives and the market takes away with great fury.

12. Don't forget the plan -
Remember the reasons you took the trade in the first place, and don't get blinded by volatility.

13. Don't have a paycheck mentality -
You don't deserve anything for all of your hard work. The market only pays off when you're right, and your timing is really, really good.

14. Don't join a group -
Trading is not a team sport. Avoid stock boards, chatrooms and financial TV. You want the truth, not blind support from others with your point of view.

15. Don't ignore your intuition -
Respect the little voice that tells you what to do, and what to avoid. That's the voice of the winner trying to get into your thick head.

16. Don't hate losing -
Expect to win and lose with great regularity. Expect the losing to teach you more about winning, than the winning itself.

17. Don't fall into the complexity trap -
A well-trained eye is more effective than a stack of indicators. Common sense is more valuable than a backtested system.

18. Don't confuse execution with opportunity -
Overpriced software won't help you trade like a pro. Pretty colors and flashing lights make you a faster trader, not a better one.

19. Don't project your personal life -
Trading gives you the perfect opportunity to discover just how screwed up your life really is. Get your own house in order before playing the markets.

20. Don't think its entertainment -
Trading should be boring most of the time, just like the real job you have right now. 

http://jodnet.blogspot.com
read moor ,,,

| 0 التعليقات ]

20 Golden Rules for Traders


jodnet
Want to trade successfully? Just choose the good positions and avoid the bad ones. Poor trade selection takes a heavy toll as it bleeds your confidence and wallet. You face many crossroads during each market day. Without a system of discipline for your decision-making, impulse and emotion will undermine skills as you chase the wrong stocks at the worst times.
Many short-term players view trading as a form of gambling. Without planning or discipline, they throw money at the market. The occasional big score reinforces this easy money attitude but sets them up for ultimate failure. Without defensive rules, insiders easily feed off these losers and send them off to other hobbies.
Technical Analysis teaches traders to execute positions based on numbers, time and volume. This discipline forces traders to distance themselves from reckless gambling behavior. Through detached execution and solid risk management, short-term trading finally "works".
Markets echo similar patterns over and over again. The science of trend allows you to build systematic rules to play these repeating formations and avoid the chase:
1. Forget the news, remember the chart. You're not smart enough to know how news will affect price. The chart already knows the news is coming.
2. Buy the first pullback from a new high. Sell the first pullback from a new low. There's always a crowd that missed the first boat.
3. Buy at support, sell at resistance. Everyone sees the same thing and they're all just waiting to jump in the pool.
4. Short rallies not selloffs. When markets drop, shorts finally turn a profit and get ready to cover.
5. Don't buy up into a major moving average or sell down into one. See #3.
6. Don't chase momentum if you can't find the exit. Assume the market will reverse the minute you get in. If it's a long way to the door, you're in big trouble.
7. Exhaustion gaps get filled. Breakaway and continuation gaps don't. The old traders' wisdom is a lie. Trade in the direction of gap support whenever you can.
8. Trends test the point of last support/resistance. Enter here even if it hurts.
9. Trade with the TICK not against it. Don't be a hero. Go with the money flow.
10. If you have to look, it isn't there. Forget your college degree and trust your instincts.
11. Sell the second high, buy the second low. After sharp pullsbacks, the first test of any high or low always runs into resistance. Look for the break on the third or fourth try.
12. The trend is your friend in the last hour. As volume cranks up at 3:00pm don't expect anyone to change the channel.
13. Avoid the open. They see YOU coming sucker
14. 1-2-3-Drop-Up. Look for downtrends to reverse after a top, two lower highs and a double bottom.
15. Bulls live above the 200 day, bears live below. Sellers eat up rallies below this key moving average line and buyers to come to the rescue above it.
16. Price has memory. What did price do the last time it hit a certain level? Chances are it will do it again.
17. Big volume kills moves. Climax blow-offs take both buyers and sellers out of the market and lead to sideways action.
18. Trends never turn on a dime. Reversals build slowly. The first sharp dip always finds buyers and the first sharp rise always finds sellers.
19. Bottoms take longer to form than tops. Greed acts more quickly than fear and causes stocks to drop from their own weight.
20. Beat the crowd in and out the door. You have to take their money before they take yours, period.

Momentum Cycles
Reversals at the first test of a new high or low are common. Investors jump out at double tops after missing the first exit while value players buy double bottoms. Skilled traders also use this known reversal tendency to enter counter-trend positions.
 
Momentum Cycles
Markets invariably return to test prior support or resistance unless a natural barrier (such as a continuation gap) stands in the way. Besides price and pattern, common moving averages also provide classic swing reversal points.
read moor ,,,

| 0 التعليقات ]

Trading with Stage Analysis

Same as it ever was.

What if you could just glance at a price chart and find good trades immediately? It's not as hard as you think. Start by looking for recurring patterns and trends, and then see where price is trading on this "pattern tree." It should tell you right away if there's money to be made.

Stage analysis defines your location within the market universe. Stan Weinstein documented this powerful technique in his classic Secrets of Profiting in Bull and Bear Markets. He described how market action can be broken into specific stages of development.

Each stage has its own characteristics and favors certain strategies over others. For example, uptrends are better for buying stocks, while downtrends are better for selling short. It may sound simple, but many of us do exactly the opposite.

I've reconfigured these mechanics into a concept called pattern cycles. These focus on the cyclical aspect of stage analysis, and how traders use them to capitalize on a wide variety of market flavors. Pattern cycles track markets through repeating crowd behavior. They are evolutionary -- i.e., one phase naturally progresses into the next. They signal the strategy that works best in the current phase, and what to expect from the next one.

What are these repeating cycles? They follow the common TA language we've learned over the years -- bottoms, breakouts, uptrends, new highs, tops, breakdowns and downtrends. Each phase also defines a trend-range axis that carries price sideways, upward or downward in a predictable manner.

One overriding factor complicates market-stage analysis: It exists in more than one time frame. In other words, markets will be at one stage on a weekly chart, a different one on the daily chart and yet a third on the intraday chart. Traders must deconstruct this trend relativity to achieve accurate price prediction, and take advantage of a specific stage.

Trend relativity errors wash many traders out of the markets. We recognize a stage and throw money at it. But we might forget a longer time frame that's moving against our position. You can overcome these errors by defining holding periods that align to the stages being traded. In a broad sense, this is the same process that divides market players into scalpers, daytraders, position traders and investors.

Opportunity peaks at the interface between different stages. Here are three examples. Breakout trades appear where bottoms gives way to uptrends. Pullback trades develop where price retraces to the edge of the last phase. Bursts into new highs awaken an assortment of momentum trades.

Pick your strategies wisely. There's a time to buy breakouts and a time to sell short. There's a time to press your positions and a time to take whatever the markets give you. And there's definitely a time to chase momentum and a time to trade pure price sensitivity.

Stage recognition errors hurt the investing public as well. Look at the multitude that got crushed buying the dips when the markets descended from the bubble top in 2000. And in these bear market days, investors forget that bottoms take time to develop, and returns need to be measured in years, not days.

Value investors enter the markets when bottoms are forming. Momentum traders come in during strong uptrends and downtrends. But sadly, the public enters during tops and climaxes. So whether you trade or invest, take the time to identify current stages in your individual stocks and in the broader market. This ultimately defines the best way to play your hand.

Remember that standing aside is a proactive strategy through certain stages. You won't make money when market conditions don't match your holding period or trading skills. Instead, sit on your hands and let the market come to you when the cycles makes no sense. This requires discipline, but it will keep you in the game for the long run.

Swing traders can take the next step and master a variety of stages. This lets us capitalize on a broad range of market environments. We become breakout traders when markets are on the move, but play the swing game when they're just chopping around. Diverse skills enable us to sell short when markets decline, or work the edges during extended ranges.
http://jodnet.blogspot.com
read moor ,,,

| 0 التعليقات ]

Trading Execution Zone 


A pattern is only as good as the price action that follows it. Many players get caught up in the hunt, thinking all it takes to trade is a good setup. Unfortunately, this approach is a great way to lose money.

Trade setups are predictive archetypes, nothing more and nothing less. Some evolve with textbook perfection, while others show no regard at all for your expert opinion.

Good trade execution is a three-step process. You find the pattern, you study how price interacts with it, and you decide whether or not to pull the trigger. A good percentage of setups never reach the moment of decision and should be discarded without a second thought. Many traders have trouble with this limitation, because they expect the markets to pay off like a racetrack, through a simple pick-and-play strategy. In other words, they take positions the same way a gambler bets on horses. But the markets don't work this way, and setups can't be treated like tipsheets.

When I post a new pattern, someone always asks when they're "supposed" to take the trade. I tell them to take it when they get a buy or sell signal. Of course, this makes things worse, because many folks don't know what signals look like. So perhaps a little instruction is in order.

The execution target defines where to buy or sell short. A good setup points to this price through support-resistance, pattern recognition and the reward-risk ratio. A couple of limitations affect execution targets, though. First, any external forces that might affect the trade opportunity must be considered as well before taking the trade. Second, the target will change dynamically as new data alter the setup. It's possible a single tick will affect the calculated reward-risk ratio and bust the intended trade entirely.

The execution zone stands between current price and the execution target. This is an attention boundary for your trade entry. You shift focus toward the execution target when price penetrates the execution zone. So where do you draw this important interface? Place it at a distance that allows adequate time to examine whether or not to take the trade when price hits the target.

Use common sense to identify useful execution zones. Look at recent volatility and measure a fixed distance from the target. Or locate the last support level your setup must pass through before reaching the execution target, and place it there.

You have three entry choices on most trade setups:

- Enter in congestion near a breakout or breakdown.
- Stand aside when the breakout or breakdown occurs, and wait for a pullback.
- Try to get in as a breakout or breakdown starts, and hope to get filled at a good price.


Each entry strategy fosters its own execution zone/execution target combination. The key is to enter long near substantial support, or sell short near substantial resistance. Of course, this is harder to do than it sounds. Emotions rise in moving markets, and the decisions we take in the heat of battle may not be the best ones for that setup. But that's part of the fun of swing trading.

Let's look at two examples.

Genesis Microchip (GNSS) had a triple-bottom short setup last week. But bad timing empties trading accounts on this volatile stock. So when was the right time to sell it short?

Genesis printed a NR7 (narrowest range bar of the last seven bars) just before collapsing into the mid-40s. This would have been an excellent place to enter, but it would have required seeing the signal just before the close, and then jumping in. The trader could also sell short the next morning when the stock gapped down, but a bad fill would place the position at risk for a reversal or short squeeze. The third method is still on the table. Genesis may still rally back to the breakdown level and present a very low-risk entry.

Manhattan Associates (MANH) also set up an interesting short sale last week, but the outcome was quite different. It sat near a double-bottom failure, but overnight news gapped up the stock. Because the failure never triggered, there was no risk from short entry choices two or three. But there was risk if a short position was entered on the prior bar, in the bottom congestion.

The good news is this narrow zone triggered an exit signal as soon as the stock gapped up above it. And the fill on a position in this quiet zone would make any loss more palatable.

http://jodnet.blogspot.com
read moor ,,,

| 0 التعليقات ]

The Profitable Trader 


Let's look at the differences between profitable and unprofitable traders. Is it a question of experience, or are some folks just born with the talent to play the markets successfully? How does risk tie in with profitability? Are profitable traders more willing to make riskier trades?

Author Mark Douglas talks about three stages in becoming a profitable trader. First you learn how to find promising trade setups. Second, you learn how to enter and exit those positions at the right time. Third, get to a point where you build equity on a consistent basis. The secret to this third step is really no secret at all. You master the discipline required to follow your methodology, plan or system.

Traders need to make an important choice early in their careers. They can decide to follow a specific method that forces them out of the market during unfavorable conditions. Or they can master a broad range of skills, and then apply the right one at the right time. Neither approach is right or wrong, but both require paying close attention to the profit-and-loss feedback.

Most unprofitable traders rely on a poorly matched execution style, or a good one they haven't mastered yet. Very often they fail to recognize critical errors in their methodology because it was learned in a book, or through inappropriate conditioning, i.e., making money on bad decisions. Realize that profitable traders know all the weak points in their strategies and exercise damage control at all times.

You can't understand your methodology until you analyze your profits and losses. Identify its weaknesses quickly, and then decide if it really works at all. You may discover that your whole approach to the market isn't right for your lifestyle, emotional nature or long-term goals. For example, you could be a scalper with the disposition of an investor, or a daytrader who hates risk. Bad things will happen when your system doesn't match your personality.

Traders hate to think about discipline. After all, it's not as sexy as just becoming a market gunslinger. But the bottom line is that most of us don't follow our own rules. This is ironic, because the folks who ignore the reasons they lose money are the same ones who spend thousands of dollars attending trading seminars. Personal discipline is the one thing you can't learn sitting in an audience.

Discipline and money management go a long way toward becoming a profitable trader. But let's be realistic. However you trade, you must be confident in the positive expectancy of your style or methodology. This poorly understood concept refers to how much profit you can reasonably expect to make vs. each dollar risked on a trade. Gamblers know this equation as the player's edge in a casino. The problem is that most of us don't understand our strategy well enough to determine whether or not it has a positive expectancy.

System traders use backtesting to gauge the positive expectancy of their systems. Retail traders choose entry and exit without this methodology, so they need to compensate through extensive record-keeping and analysis of each trade result. Even so, they could be fooling themselves into believing they have an edge in their pursuit of profitability.

The sell side of the positive expectancy equation is more important than where you buy. Research suggests that a very profitable system can be built using random trade entry. Yes, you heard that right. It's possible to make money in the same way as a chimp who throws darts at a dartboard. But the hairy primate still has the same problem as the losing trader: He doesn't know when to take money off the table.

Positive expectancy requires a robust exit strategy. But you already knew that, didn't you? Volumes have been written about money management techniques, such as cutting your losses, riding your winners and trading adequate reward/risk. But somehow, losing traders continue to outnumber profitable ones by a very wide margin.

One aspect of positive expectancy is more difficult to manage than any pure numbers game. All trading styles experience drawdowns, and profitable ones are no exception. Traders routinely abandon profitable methods because they hate to lose money. They stop following perfectly good rules because they aren't getting the instant gratification they want from the markets.

If this all sounds like a big loop from the top of our discussion, it's meant to be that way. Losing traders get stuck in a vicious cycle. They want to profit from the market so they come up with a strategy to make money. They trade the strategy until it frustrates them to the point they abandon it and go looking for another strategy. In the process, they never take the time to find out whether or not it had positive expectancy in the first place. In other words, they don't let their methodology mature enough to watch its real potency bear fruit.

Which brings us back to discipline. Sure, it's boring to plan the trade and trade the plan. But it's the only way to break this losing cycle and get on the road to consistent profitability. 

http://jodnet.blogspot.com
read moor ,,,

| 0 التعليقات ]

Scanning Tips and Techniques 


We spend too much time looking for stocks to trade. Surprisingly, stock picking is one of the easiest skills a new trader can learn (while actually taking a position is one of the hardest).

The trick to finding good setups is scanning dozens of charts in seconds, instead of hours. And this isn't as hard as it looks.

First, let's talk about stock scanning. Chart database programs (such as Worden's TC2000) feature advanced market scanning tools. With them, you can write Boolean statements that will search quickly for your needle in the market haystack.

Many folks think the purpose of scanning is to find perfect trades that can be mindlessly executed. Nothing could be further from the truth. The best scans just take you to the next step, where you discover the opportunity for yourself.

Your two eyes are better tools for locating good trades than the most carefully written market scans. The most effective formula will uncover a lot of useless garbage but also let you find the real gems. So keep your search sloppy, and don't try to optimize. Instead, put your resources into a fast computer that lets you flip through your output at the speed of light.

Let's examine five visual aids to speed up your stock scanning. Train your eyes to look at charts in this way the next time you sit down to do your market homework.

You don't want to ski on the Bunny Slopes. There's little profit for traders when price rises or falls in a very gentle pattern. Real opportunity comes when strong tension between conflicting forces gets released in a big move. Bunny slopes never build that tension and should be avoided if you're looking for short-term gains. The good news is it takes only a second to see this flaw on a price chart.

Border Disputes happen between price bars and intermediate moving averages. These conflict levels define important setups because so many players react to these zones. Keep your eye on the interplay between price, the 50-day and 200-day moving averages as you flip through your charts. No single pattern defines these disputes, so stop and investigate when you see something interesting.

Davy and Goliath traps many traders. This trend-relativity error happens when you see a great pattern, but miss the support or resistance that's going to screw it up. Avoiding this error is simple. Look above and below the breakout price for the setup that's catching your eye. Then do the math. How far will it travel before it runs into the mean ogre?

Trend Mirrors tell you to look to your left before taking a trade. Mirrors show all the past stuff that's going to affect price movement right now. One of the great trading secrets is that price reacts a lot more than it acts. In other words, old debris in the charting landscape generates most price swings. So look for all the past highs/lows, gaps, volume spikes and candle shadows when you see an interesting setup in the present.

If you have to look, it isn't there. The Bad Hair Day refers to a price chart that makes absolutely no sense when you first look at it. So what do you do when an oddball pattern catches your eye? You waste more time and try to figure it out. When a chart doesn't slap you across the face at first glance, move on and find one that does. 
http://jodnet.blogspot.com
read moor ,,,

| 0 التعليقات ]

Pattern Cycles: Bottoms
Price marks territory as it spikes relative highs and lows within all time frames. Skilled traders observe this signature behavior throughout all markets and all historical charting. Relative direction also characterizes price movement. A series of lower lows and lower highs identify downtrends while uptrends print a sequence of higher highs and higher lows.

As bulls and bears fight for control, Pattern Cycles are born. Since markets won't travel upward to infinity or downward below zero, identifiable swing trades appear within each time frame. Driven by emotional behavior, trend inhales and exhales. Falling price ignites fear as paper profits evaporate. Fresh rallies awaken greed, inviting momentum players to become greater fools. On and on it goes.

BOTTOMS

Bottoms exist as a direct result of this trend physics. The natural movement of impulse and reaction dictates that two unique formations must develop at some point within each Pattern Cycle. In an uptrend, a lower high must eventually follow a higher high and mark a new top. In a downtrend, the sequence of lower lows ends when price prints a higher low. This second event marks the birth of the Double Bottom.

Double bottoms draw their predictive power from the trends that precede them. As a series of lower lows print on a bar chart, downtrends often accelerate. The trading crowd notices and develops a gravity bias that expects the fall to continue unabated. Then suddenly the last low appears to hold. The crowd takes notice and bottom fishers slowly enter new positions. Price stability then triggers more and more players to recognize the potential pattern and jump in.

Stock percentage growth potential peaks at the very beginning of a new uptrend. For this reason, being "right" at a bottom can produce the highest profit of any trade. But picking bottoms can be a very dangerous game. Smart traders weigh all evidence at their disposal before taking the leap. And strict risk discipline must still be exercised to ensure a safe exit if proven wrong.

Eve's rounded bottom takes longer to form than the sharp Adam spike. Look for volume to decrease as the stock heals and prepares for a new uptrend. Adam and Eve formations aren't limited to bottoms. Watch for them at the end of parabolic rallies.
The Adam and Eve Reversal illustrates the importance of the center peak in the creation of Double Bottoms. A very sharp and deep first bottom (Adam) initiates this DB pattern. The stock then bounces high into a center retracement before falling into a gentle, rolling second bottom (Eve). Price action finally constricts into a tight range before the stock breaks strongly to the upside.

Many times the top of Eve prints a flat shelf that marks an excellent entry point. Shelf resistance typically develops right along the top of the center retracement pivot. The relationship between this center pivot and current price marks an important focal point as the skilled trader closely watches the development of a suspected double bottom pattern.

Since bottoms occur in downtrends, risk must be managed defensively. The greedy eye wants to believe the immature formation and is easily fooled. Even spectacular reversals offer little profit if price can't ascend back out of the hole it found itself in. When choosing stop and exit points, violation of a prior low is the natural first choice. Make certain your entry permits you to exit for an acceptable loss at this location. And don't stick around long. Price will gather downside momentum quickly at broken lows as it searches for new support.

Successful bottom entry takes a strong stomach. Even when all the technicals line up, sentiment will be highly negative at these turning points. The potential for short-term profit though is outstanding. In addition to other longs ready to speculate on a good upside move, high short interest will fuel explosive impulses off these levels. Perhaps for this reason alone, serious traders can't ignore double bottom patterns.

The Big W pattern can be identified in all time frames and all markets. It is a powerful tool for locating bottom trade entry.
The Big W reference pattern maps the entire bottom reversal process. This signpost identifies key pivots and flashes early warning signals. The pattern begins at a stock's last high, just prior to the first bottom. The first bounce after this low marks the center of the W as it retraces between 38% and 62% of that last downward move. This rally fades and price descends back toward a test of the last low. The smart trader then listens closely for the first bell to ring. A wide range reversal bar (doji or hammer) may appear close to the low price of the last bottom. Or volume spikes sharply but price does not fail. Better yet, a Turtle Reversal prints where price violates the last low by a few ticks and then bounces sharply back above support. When any or all of these events occur, focus your attention on the second leg of this Big W.

Aggressive traders can initiate entry near the bottom of this second leg when the bell rings loudly. The middle of the W now becomes your pivot for further execution. For price to jump to this level, it must retrace 100% of the last decline. This small move finally breaks the falling bear cycle.

Enter less aggressive positions when this emerging second bottom retraces through 62% of the fall into the second low. But sufficient profit must exist between that entry and the W center top for this trade to work. Longer-term traders can hold positions as price pierces this pivot. Be patient since price will likely pause to test support here.

Then expect another upward leg. Price at this level has a high probability of moving even higher. It can easily retrace 100% of the original downward impulse, completing both the Double Bottom and Big W patterns. This tendency allows for further entry at the first pullback to the center pivot after the next break. 

http://jodnet.blogspot.com

read moor ,,,

| 0 التعليقات ]

Pattern Cycles: Breakouts 

Significant declines evolve into long bottoms characterized by failed rallies and retesting of prior lows. As new accumulation slowly shakes out the last crowd of losers, a stock's character changes. Prices push toward the top of key resistance. Short-term relative strength improves and the chart exhibits a series of bullish price bars with closing ticks near their highs. Finally the issue begins a steady march through the wall marked with past failures.

Stocks must overcome gravity to enter new uptrends. Value players build bases but can't supply the critical force needed to fuel rallies. Fortunately, the momentum crowd arrives just in time to fill this chore. As a stock slowly rises above resistance, greed rings a loud bell and these growth players jump in all at the same time.

The appearance of a sharp breakout gap has tremendous buy power. But the skilled trader should remain cautious when the move lacks heavy volume. Bursts of enthusiastic buying must draw wide attention that ignites further price expansion. When strong volume fails to appear, the gap may fill quickly and trap the emotional longs. Non-gapping, high volume surges provide a comfortable price floor similar to gaps. But support can be less dependable, forcing a stock to swing into a new range rather than rise quickly.

Fortunately this scenario sets up good pullback trades. The uptrend terrain faces predictable obstacles marked by Clear Air pockets and congestion from prior downtrends. These barriers can force frequent dips that mark good buying opportunities. The trader must identify these profitable zones in advance and be ready to act.

Gap breakouts are more likely to rise toward higher prices immediately than simple volume breakouts. Waiting for a dip may be futile. Extreme crowd enthusiasm ignites continued buying at higher levels and market makers don't need pullbacks to generate volume. If entry is desired, use a trend-following strategy and manage risk with absolute price or percentage stop loss.
As trend builds momentum, surges register on technical indicators such as MACD and ADX. Volatility absorbs each thrust and parabolic rallies erupt. Dips will cease during these runaway expansion moves as price range expands bar to bar, often culminating in a second (continuation) gap and a final exhaustion spike.

After rapid price movement, markets need time to absorb instability generated by that trend's momentum. They pause to catch their breath as both volume and price rate of change drop sharply. During this consolidation period, new price levels undergo continuous testing for support and resistance. To the pattern reader, this range phenomenon reveals itself through the familiar shapes of Flags, Pennants and Rectangles.

Relatively simple mechanics underlie the formation of these continuation patterns. The orderly return to a market's mean state sets the foundation for a new thrust in the same direction. In a series of sharp trend moves, congestion tends to alternate between simple and complex in both time and size. Trade defensively when the prior pattern was both short and simple. Go on the offense after observing an extended battle in the last range.

When examining continuation patterns, traders must pay close attention to proportionality. This visual element will validate or nullify other predictive observations. Constricted ranges should be proportional in both time and size to the trends that precede them. When they take on dimensions larger than expected from visual examination, odds increase that the observed range actually relates to the next trend larger in scale than the one being viewed. This can trigger devastating trend relativity errors, in which positions are executed based on patterns longer or shorter than the time frame being traded.

All patterns must be evaluated within the context of trend relativity. The existence of any range depends upon the time frame being analyzed. For example, a market may print a strong bull move on the weekly chart, a bear on the daily and a tight continuation pattern on the 5-min bar, all at the same time. A range drawn through one time frame does not signal similar conditions in the other periods that particular market trades through. 

http://jodnet.blogspot.com
read moor ,,,

| 0 التعليقات ]

Pattern Cycles: Trends 


The cult of Elliott Wave Theory intimidates the most experienced traders. But don't let wave voodoo stop you from adding important elements to your chart analysis. Strong trends routinely print orderly action-reaction waves. EWT uncovers these predictive patterns through their repeating count of 3 primary waves and 2 countertrend ones.

Wave impulses correspond with the crowd's emotional participation. A surging 1st Wave represents the fresh enthusiasm of an initial breakout. The new crowd then hesitates and prices drop into a countertrend 2nd Wave. This coils the action for the sudden eruption of a runaway 3rd Wave. Then after another pullback, the manic crowd exhausts itself in a final 5th Wave blowoff.

Traders can capitalize on trend waves with very little knowledge of the underlying theory. Just look for the 5-wave trend structure in all time frames. Locate smaller waves embedded in larger ones and place trades at points where two or more time frames intersect. These cross-verification zones capture major trend, reversal and breakout points.

For example, the 3rd wave of a primary trend often exhibits dynamic vertical motion. This single thrust may hide a complete 5-wave rally in the next smaller time frame. With this knowledge execute a long position at the 3rd Of A 3rd, one of the most powerful price movements within an entire uptrend. While waves seem hard to locate, the trained eye can uncover these price patterns in many strong uptrends.

Many 3rd waves trigger broad Continuation Gaps. These occur just as emotion replaces reason and frustrate many good traders. Since common sense dictates the surging stock should retrace, many exit positions on the bar just prior to the big gap. Use timely wave analysis (and a strong stomach) to anticipate this big move just before it occurs.

4th Wave corrections set the sentiment mechanics for the final 5th wave. The crowd experiences its first emotional setback as this countertrend generates fear through a sharp downturn or long sideways move. The same momentum signals that carry traders into positions now roll over and turn against them.

The greedy crowd ignites a powerful December rally in AMGN. Note the embedded 5 wave patterns, typical with surging uptrends. The 3rd of a 3rd identifies the most dynamic momentum expected in a sharp price move.
As they prepare to exit, the trend suddenly reawakens and price again surges. During this final 5th wave, the crowd loses good judgement. Both parabolic moves and aborted rallies occur here with great frequency. Survival through the last sharp countertrend adds an unhealthy sense of invulnerability into the crowd mechanics. Movement becomes unpredictable and the uptrend ends suddenly just as the last greedy participant jumps in.

When trend finally turns back through old price, skilled traders then use past action to identify effective momentum and swing trades. Battles between bulls and bears leave a scarred landscape of unique charting features. For example, gaps provide one of the most profitable setups in all of technical analysis. Continuation gaps rarely fill on the first try, except with another gap. Use a tight stop and execute your trade in the direction of support as soon as price enters the gap on high volatility.

Past breaks in support identify low risk short sales. The more violent the break, the more likely it will resist penetration. Head & Shoulders, Rectangles and Double Tops leave their mark with strong resistance levels. These patterns often print multiple doji and hammer lows prior to a final break as insiders clean out stops at the extremes of the pattern.

Clear Air prints a series of wide range bars as price thrusts from one stable level to another. Rapid price movement tends to repeat each time that trading enters its boundaries. Potential reward spikes sharply through these unique zones. But watch out. Reversals tend to be sharp and vertical as well. Tight stops are advised.

Pattern Cycles recognize that important features may not be horizontal. What the eye resolves as uptrend or downtrend contains multiple impulses shooting out in many directions. The most common of these is the Parallel Price Channel. Use these price extremes to enter contrary positions with stop losses just on the other side of the parallel trendlines.

  http://jodnet.blogspot.com
read moor ,,,

| 0 التعليقات ]

Pattern Cycles: Highs
Short-term traders discover great rewards in uncharted territory. Stocks at new highs generate unique momentum properties that ignite sharp price moves. But these dynamic breakouts can also demonstrate very unexpected behavior. Old battlegrounds of support/resistance disappear while few reference points remain to guide entry and exit. In this volatile environment, risk escalates with each promising setup.

The final breakout to new highs completes a stock's digestion of overhead supply. But the struggle for greater gains is far from over. Issues reaching new highs often undergo additional testing and preparation before resuming their dynamic uptrends. The skilled trader can follow this building process through the typical pattern development expected during these events.

Price may return to test the top of prior resistance several times. This can create a variety of stepping or basing ranges before trend finally moves sharply upward. Other times, stocks will immediately go vertical when new highs are printed. The challenge is to decide which outcome is more likely.

Use Accumulation-Distribution analysis to predict whether new highs will escalate immediately or just mark time. Price either leads or lags accumulation. When stocks reach new highs without sufficient ownership or buying pressure, they will often pause to allow these forces to catch up. Other times, accumulation builds more strongly than price. The initial thrust to new highs confirms this accumulation. The breakout triggers a new round of buying interest and price immediately takes off with no basing phase.

On Balance Volume and similar accumulation-distribution indicators are essential tools to evaluate the strength of new high breakouts. Expect an immediate upward thrust when OBV draws a pattern more bullish than the price chart. Alternatively, when multiple acc-dis readings show ownership limping behind price, prepare for an extended basing period. And always use caution with NASDAQ stocks. Their odd transaction reporting may lead to false OBV readings.

Final phases of congestion often print sharp initiation points for the breakout impulse. Locate this hidden root structure in double bottom lows embedded within the congestion just prior to the trend move. The distance between these lows and the top resistance boundary will yield price targets for the subsequent rally. Barring larger forces, this new high breakout should extend no more than 1.38 times the distance between that low and the resistance top before establishing a new range.

Once price clears a new high base, the bull impulse escapes the gravity of final congestion. This often triggers a dramatic 3rd wave for the trend initiated at the congestion low. This thrust can easily exceed initial price targets when it converges with larger scale wave movement. In other words, when forces in the daily and intraday charts move into synergy, trend movement will inevitably be more dramatic than anticipated. 


When complex basing occurs early in a dynamic uptrend, alternation predicts major price thrusts with few retracements. This CMGI parabolic move supports that theory. Note the extended range at the right shoulder of the Inverse Head & Shoulders pattern, probably driven by inadequate accumulation. Once the building process was complete, price ejected into an astounding rally.
Measure ongoing new highs with a MACD Histogram or other widely used momentum indicator. Whatever your choice, allow your math to support the pattern rather than the other way around. For example, if an established trendline can be drawn under critical lows, key your trade timing off that line rather than waiting for your indicator slope to turn up or down.

Effective trading of post-gravity impulses relies on the interaction between current price and your momentum indicator. At new highs, prior support/resistance can't be used to predict swings. Follow the MACD slope to flag overbought conditions favorable for ranges or reversals. Enter long positions when price falls but the slope begins to rise. Or be conservative and wait for the zero line to be crossed from below to above.

Patterns point to low risk momentum trades. Enter retracements to a trendline or moving average and you'll ride the dips just as new buyers jump in. Short sales should be avoided completely when momentum is high unless you're an experienced trader. Trying to pick tops is a loser's game. Delay short sales until momentum drops sharply but price is high within its range. Pattern analysis can then locate favorable countertrends with limited risk.

When a stock breaks to new highs, how long will the rally last? In physics, a star that burns bright extinguishes itself long before one emitting a cooler, darker light. So it is with market rallies. Parabolic moves cannot sustain themselves over the long haul. Alternatively, stocks that struggle for each point of gain eventually give up and roll over. So logic dictates that the most durable path for uptrends lies somewhere in-between these two extremes.

Overbought conditions lead to a decline in price momentum and illustrate one ever-present danger when trading new highs: stocks may stop rising at any moment and enter extended sideways movement. Watch rallies closely with your toolbox of technical indicators to uncover any early warning signs for this range development.

The first break in a major trendline that follows a big move flags the end of a rally and beginning of sideways congestion. Exit momentum-based positions until conditions once again favor rapid price change. In this environment, consider countertrend swing trades if other forces favor success. But stand aside once volatility slowly dissipates and crowd participation fades. 

http://jodnet.blogspot.com
read moor ,,,

| 0 التعليقات ]

Pattern Cycles: Tops 


No trend lasts forever. Inevitably, crowd enthusiasm outpaces a stock's fundamentals and rallies stall. But topping formations do not end uptrends all by themselves. These stopping points may only signal short pauses that lead to higher prices. Then again, they could be long-term highs just before a major breakdown.

What hidden patterns can you use to identify and trade reversals before your competition sees them? Successful short-term traders get in the reversal door early and allow the herd to trigger sharp price movement. Familiar trend-change formations, such as the Head & Shoulders and Double Tops, take so long to develop that many profitable entries pass before they finally signal an impending break to the waiting crowd.

First Rise/First Failure offers traders an early method to identify reversals following new highs or lows in any time frame. FR/FF identifies the first 100% retracement of a dynamic trend move within the time frame of interest. In order for any trend to continue, price movement should find support near a 62% retracement, measured from the starting point of the last thrust that pushed price to the new high or low. From this pullback, trend must base and test its extension before it can break out to further continuation highs or lows.

Cross-verification rings a loud bell. Note how the uptrend line broke on the same bar as the violation of the 62% fib retracement following this late 1998 AMZN explosion. The familiar triangular shape of First Rise-First Failure makes identification easy when flipping through many price charts.
100% retracement violates the major price direction and terminates the trend it corrects. Completion also provides significant support/resistance, where bounce trades can be initiated with low risk. From this point, continuation trends may reawaken in the next larger time frame by a new break through the 38% (prior 62%) S/R and continued push past the 62% retracement, toward a test of the high/low extension.

Bounce reversals represent superb entry points when the 100% violation coincides with a 38% or 62% retracement of the next higher dynamic time frame. However risk: reward requires careful measurement, as the trade may develop more slowly than expected. In other words, a successful position must be held through expected congestion at the 38%-62% zone before it can access a profitable retest of the double top/double bottom extreme.

Allow minor testing violations for all major Fibonacci retracements before taking positions. Specialists and Market Makers know these hidden turning points and conduct stop-gunning exercises to take out volume just beyond the breaks. And watch out for trend relativity errors. Bull and bear markets exist simultaneously through different time frames. Limit FR/FF trades to the time frame for which the retracement occurs unless cross-verification supports other setups.

Every popular topping formation has its own unique pattern features. But all tell a common tale of crowd disillusionment. Whether printed in the manic highs and lows of the Head & Shoulders or the slow capitulation of the Rising Wedge, the final result remains the same. Price breaks sharply to lower levels while unhappy shareholders unload positions as quickly as they can.

Early in a rally, value and improving fundamentals attract knowledgeable holders. But as an uptrend develops, the motivation for new participants becomes vastly different. News of a stock's rise generates excitement and attracts a greedier crowd. These momentum players slowly outnumber the value investors and stock movement becomes more volatile. The issue continues upward as this frantic buying crowd feeds on itself well beyond most reasonable price targets.

Both fire and ice will kill uptrends. As long as the greater fool mechanism holds, each new long allows the previous one to turn a profit. Eventually changing conditions force a final end to the upside action. A shock event can suddenly kill the buying enthusiasm, forcing a sharp and immediate reversal. Or the trend's fuel just runs out as the last interested buyer enters one last position.

Many traders mistakenly assume bulls turn into bears immediately following a dramatic, high volume reversal. They enter short sales well before the physics of topping and decline rob the crowd of its momentum. In fact, these early shorts provide fuel for the sharp covering rallies seen in most topping formations.

Skilled traders wait and measure the process of crowd disillusionment before they enter large short sales. Decline characteristics can be predicted with great accuracy using pattern analysis. While they wait, the repeating character of the topping event provides a natural playground for swing positions. 

http://jodnet.blogspot.com
read moor ,,,

| 0 التعليقات ]

Pattern Cycles: Reversals 


No chart pattern better illustrates this slow evolution from bull market to bear decline than the Descending Triangle. Within this simple structure, the trader examines how life drains slowly from a dynamic uptrend. Variations of this destructive formation precede more breakdowns than any other reversal. And they can be found doing their dirty deeds in all time frames and all markets.

But why does it work with such deadly accuracy? Most traders don't understand how or why patterns predict outcomes. Some even believe these important tools rely on mysticism or convenient curve fitting. The simple truth is more powerful: congestion patterns reflect the impact of crowd psychology on changes in price and momentum.

Shock and fear quickly follow the first reversal marking the triangle's major top. But many shareholders remain true believers and expect their profits will return when selling dissipates. They continue to hold as hope slowly replaces better judgement. The selloff then carries further than anticipated and their discomfort increases. Just as pain begins to escalate, the correction suddenly ends and the stock firmly bounces.

For many longs, this late buying reinforces a dangerous bias that they were right all along. Renewed confidence even prompts some to add to positions. But smarter players have a change of heart and view this new rally as a chance to get out. As they quietly exit, the strong bounce loses momentum and the stock once again turns and fails. Those still riding the issue now watch the low of the first reversal with much apprehension.

Prior countertrend lows present trading opportunities for those familiar with double bottom behavior. As price descends a second time toward the emotional barrier of the last low, traders step in looking for a good DB play. Price again stabilizes near that prior value, encouraging new investors (with very bad timing) to enter final long positions.

By this time, the stock's bullish momentum has slowly drained through the criss-cross price swings. Relative strength indicators now signal sharp negative divergences as price continues to hold up through this sideways action. Momentum indicators roll over and Bollinger Bands contract as price range narrows.

The double bottom appears to hold as a weak rally draws a third high. But this final bounce fades and traders exit quickly. Shorts now smell blood and enter initial positions. Fear increases and stops build just under the double low shelf. Price returns for one final test as negative sentiment expands sharply. Often, price and volatility then contract right at the break point.

SEEK sketches a perfect Descending Triangle reversal and breakdown following its 1998 rally. Sharp, parabolic rallies often set the stage for dramatic topping formations. Note how the triangle is also a variation of the Adam and Eve pattern. 
 
The bulls must hold this line. However, odds have now shifted firmly against them. Recognizing the imminent breakdown, traders use all upticks to enter new short sales and counter any weak bull response. Finally, the last positive sentiment dies and horizontal support violates, triggering the stops. Price spirals downward in a substantial price decline.

Stock charts print many unique topping formations. Some classics can be understood and traded with very little effort. But the emotional crowd also generates many undependable patterns as greed slowly evolves into mindless fear. Complex Rising Wedges will defy a technician's best effort at prediction while the odd Diamond pattern burns trading capital swinging randomly back and forth.

Skilled traders avoid these fruitless positions and only seek profit where the odds strongly favor their play. They first locate a common feature found in most topping reversals: price draws at least one lower high within the broad congestion before violating a major uptrend. This common double top mechanism becomes the focus for their trade entry. From this well-marked signpost, they follow price to a natural breaking point and enter when violated.

Flip over the Adam and Eve bottom and you'll find a highly predictive structure for trading reversals. This Adam and Eve Top provides traders with frequent high profit short sales opportunities. Enter shorts on the first violation of the reaction low, but use tight stops to avoid turtle reversals. These occur when sharp short covering rallies suddenly erupt right after the gunning of stops below a violation point.

Each uptrend generates positive sentiment that must be overcome through the topping structure. A&E tops represent an efficient bar structure to accomplish this task. The violent reversal of Adam first awakens fear. The slow dome of Eve absorbs the remaining bull impulse while dissipating the volatility needed to resume a rally. As the dome completes, price moves swiftly to lower levels without substantial resistance.

Observant traders recognize the mechanics of Descending Triangles and Adam & Eve formations in more complex reversals. The vast majority of tops contain characteristics of these familiar patterns. Crowd enthusiasm must be eliminated for a decline to proceed. Through the repeated failure of price to achieve new highs, buying interest eventually recedes. Then the market can finally drop from its own weight. 

http://jodnet.blogspot.com
read moor ,,,

| 0 التعليقات ]

Pattern Cycles: Declines 


As uptrends end, the same crowd that lifts price provides fuel for the ensuing decline. Longs get lulled into a false sense of confidence as rally momentum fades and a topping pattern forms. As smart money quietly exits, the uptrend hits a critical trigger point: the bulls suddenly realize they're trapped. Seeking to protect profits, they start dumping the stock. Price fails and selling spirals downward through wave after wave.

Common features appear through most price declines. Several false bottoms print and fail. Volume repeatedly surges as losers unload positions and price carries well past downside target after target. Then just as hope collapses, the stock makes a final, multiple bottom.

Pattern Cycles offer a superb way for the short-term trader to understand and capitalize upon this repeating market behavior. Look no further than R. N. Elliott's work in the 1930s and you'll find the Five Wave Decline. This structure for price correction is as powerful today as it was 60 years ago. And as a parable for crowd behavior, traders can use it without understanding the broader Elliott Wave Theory.

The 1st, 3rd and 5th wave impulses in EWT become Top-1-2 in the Decline's count. Connect the 3rd (1) and 5th (2) waves with a trendline. Ignore the 1st (Top) wave, which the trendline can violate in any way it wants. The first bounce after the (Drop) may come close to that trendline but will rarely violate it.
5WDs consist of three downward impulses and two corrections. The first impulse (Top) corrects the uptrend that carries an issue to a new high. This Top begins the price failure that completes through the second impulse (1): the technical breakdown of the stock. As with rising markets, this impulse can be very dynamic. But in most declines, the worst is usually reserved for last. As this 2nd impulse completes, a false bottom paints a comforting picture that slows the selling and brings in weak longs. The selling then suddenly resumes and accelerates into a final 3rd impulse (2) that is so emotional that prices violate set targets and reasonable support zones.

The emotion of this last wave extinguishes selling pressure, bouncing the stock. Rapid upward motion ignites the first impulse of a significant countertrend. This strong rally then fails suddenly. As the longs brace for more pain, the prior low unexpectedly holds. A new crowd then steps in and price returns to the 1-2 trendline as a double bottom forms. The balance of power shifts and the stock breaks through that line into a new uptrend.

The skilled eye can see 5WDs in all time frames, from 5-min to monthly bars. And the unconscious crowd behavior represented by this fascinating pattern goes well beyond declining markets. These volatile movements fit perfectly into the larger structure of herd mentality that drives Pattern Cycles through their orderly and predictable process. 

 http://jodnet.blogspot.com
read moor ,,,

| 0 التعليقات ]

Exploring Market Physics 


The swing trader faces a considerable challenge mastering the puzzle of market movement. While most of us recognize conflict and resolution within the price chart, we fail to utilize these dependable mechanics in our trading strategies. Fortunately, repeating elements of the charting landscape offer a powerful context to understand and manage these vital aspects of trend development. Through repeating dynamics of crowd behavior, price action tends to mimic classic rules that modern scientists apply to our physical universe.

This is probably no accident of nature. Emotion and mathematics interact continuously while they draw the Fibonacci retracements that we see every day through our chart analysis. This fascinating relationship offers a glimpse into the profound order beneath common price movement. At its core, convergence-divergence between these two forces helps us to understand and trade the market swing. For example, we may search the chart for a reversal or breakout pattern that spells opportunity, but we also watch the ticker tape to gauge the crowd's emotional intensity, and to predict where it will burn out or shift gears.

Successful traders draw intuitively upon these bilateral market mechanics as they master the art of speculation. Their advanced skills correspond with the peculiar logic required to unify left and right brain functions into a focused trading methodology. Perhaps future technicians will quantify these profound interactions between herd behavior and physical law, and even open up a new branch of technical price prediction. In the meantime, let's explore some primary characteristics of these underlying market physics.


1. AN OBJECT IN MOTION TENDS TO REMAIN IN MOTION


New trends awaken within the low volatility of a rangebound market and are characterized by directional price momentum. During the early phases of new trends, volatility rises but inertia tends to slow down price rate of change. This often generates a series of tests or congestion mini-patterns while price tries to escape the influence of the old range. Eventually, momentum overcomes inertia and price movement takes on a more vertical appearance. This freedom of motion actually lowers volatility as friction eases and a one-sided market assumes control.

New trends can be very difficult to stop once they are underway. As with other objects in motion, trends feed on themselves because they draw in fresh energy (from cash and emotions on the sidelines). This induces price movement to travel well beyond arbitrary barriers, such as targets set by outside forces. But no trend can last forever or travel to infinity. Just like its physical counterpart, intervening market force will eventually stop or reverse directional price movement.

Simple friction slows down a rolling ball. Active trends experience friction in the form of market gravity. Classic trading wisdom notes that rallies take buyers, but that markets will "fall from their own weight" under the right circumstances. Unfortunately, the dynamics of this well-understood mechanism don't quite match those of Mother Earth. If they did, all markets would fall to zero as soon as buying and selling dried up. The fact that markets retain value suggests that each one has a hidden center of gravity that price development will reach if all participants step aside at the same time. This "central tendency" gently pulls market movement toward a hidden mean during quiet times, but can act with shocking intensity when price action generates strong imbalances during extreme market conditions.

The distance from the current price bar to this elusive value quantifies a level of market inefficiency at each point in time. It also defines most opportunity for the swing trader. Bollinger Bands present a common tool to measure tension on this hidden spring. But other indicators that rely upon deviation from the mean perform an adequate job as well. And don't overlook simple chart patterns. Certain formations can reveal major inefficiency through a simple set of price bars. For example, a Shooting Star candle after a strong rally signals an invisible wall to the observant speculator.

The Pull of Central Tendency: Combine candlestick patterns and Bollinger Band extremes to uncover hidden friction that will stop or reverse a strong market trend. Note how Immunex pierces the top band on July 19th, but closes back within its boundaries in a tall Shooting Star candle.
2. FOR EVERY ACTION, THERE IS AN EQUAL AND OPPOSITE REACTION


Traders at all levels must deal with the wavelike motion on price charts. These define underlying cycles that strategies must align with, or risk failure. At their core, these waves reflect constant battles between bulls and bears, and the underlying trend-range axis. Price thrusts forward in a surge of participation but then pauses to test prior boundaries and dissipate volatility. Price bars contract, volume drops significantly, and the trend pulls against its primary direction. But just as that market returns to a stable state, the action-reaction cycle suddenly regenerates and volatility surges. Fresh momentum carries the reawakened trend toward a new price level, or reverses it back toward its origins.

But why aren't markets stuck between two horizontal extremes if trend and countertrend act with equal force, and are polar opposites? The answer lies in how active markets dissipate directional force. Every buyer must eventually sell and every short seller must eventually cover. This induces layers of cycles that equalize price action and reaction over time. Swing traders observe this dynamic process in the trend relativity of different length charts for the same trading instrument. In other words, a single market may print a strong rally on the daily chart, a bear market on the 60-minute chart, and sideways congestion on the 5-minute chart, all at the same time. While this phasing process may seem chaotic, it actually reflects the dissipation of underlying action-reaction polarity. This 3-D trend-range axis also carries an added benefit: its alignment generates many of the setups in the swing trader's playbook.

Locate these important opportunities in the convergence of specific action-reaction imbalances through several layers of price activity. This logical analysis also supports the contrary attitude that leads to successful swing trading. For example, while the crowd sees a buying opportunity when price surges on heavy participation, the swing trader sees selling power increasing in that market due to the entrance of a new crowd of buyers. Fortunes are made through this type of counterintuitive logic, generated by recognition of the underlying power in market physics.

Time Frame Divergence: Price action in 3 time frames generates different support-resistance considerations while Qualcomm tries to halt a sharp decline. The daily chart prints a hammer reversal near a 6-month low. The 60-minute chart shows a bearish pullback into an ugly down gap, while the 5-minute chart offers short-term traders excellent profits through a midday bounce near whole number 50.
3. THE STAR THAT BURNS BRIGHTEST BURNS OUT FASTER THAN THE STAR THAT EMITS A COOLER, DARKER LIGHT


We measure the health of a rally or weakness of a selloff by the angle of its rise or fall. Common sense dictates that more vertical price bars reflect more powerful price moves. But how does the intensity of price change interact with the persistence of the trend itself? To answer this question, we can rely upon the characteristics of central tendency discussed earlier. If each market carries an underlying fair value at each point in time, a dynamic move should reach that price in less time (fewer bars) than a slow hike in the same direction. In other words, vertical trend bars should burn out and end their movement much sooner than slower trend bars.

Unfortunately these angles of inclination and declination are relative to the observer. Low price distorts movement on arithmetic charts. A spectrum of growth rates distorts movement on log charts. So before we can objectively measure how bright our market star burns, we need to adopt a common system of viewing price change. Unfortunately this is more difficult than it first appears. Diverse charting types and methods force us to apply measurements that are often dependent upon the software or service that we use. The most fruitful analysis adopts a common view across an entire database, so that visual comparison of trend intensity has a point of reference. Then we can use our eyes and simple standard deviation to examine the duration and stability of price change.

Apply this charting method to locate parabolas that are ripe for strong reversals. In the contrary view of the swing trader, vertical price movement is seen as a prelude to a reaction of the same intensity in the opposite direction. Just as a supernova signals the imminent demise of an aging star, the parabola informs the market that its trend fuel is about to run out, and likely cause a violent reaction. First set a fixed log chart percentage between 15% and 20%. Then scan the entire database for issues with the steepest angles of short-term price change. Isolate those markets with the tallest price bars and visible trends in excess of 45 degrees. Then reset the log scale to automatic for these filtered issues, so that recent price action fills the screen. Apply a standard Bollinger Band and look for bars that print well outside the upper or lower band. Find your fade entry level by dropping down to a lower time frame and locating a small-scale reversal pattern that aligns well with broader landscape features.

A trend that moves at a very shallow angle also predicts its own demise, but for different reasons. This reversal follows the mechanics of the rising or falling wedge patterns seen on many price charts. Both traders and investors want excitement in their lives. They buy or sell so they can watch price ramp to new levels. Shallow trends never fulfill this need for gratification. For example, participants watch price rise in an uptrend to a marginal new high over and over again, but never gather enough momentum to accelerate the rate of ascent. Shareholders eventually lose interest in this type of price action and jump ship in search of a more exciting trading vehicle. The market loses broad sponsorship and finally drops off a cliff.

Locating Blowoffs: Skilled eyes uncover the most dynamic parabolic trends and then execute fading strategies at natural reversal levels. Start with a fixed log chart setting, such as the 15% in figure A. Scan your database quickly and locate the most vertical price movement that you can find, up or down. Return to a more comfortable chart scale (figure B) and apply 3-D charting landscape techniques to identify low-risk entry.
4. ENERGY SOURCES LEAVE TELLTALE SIGNATURES IN THE FORM OF EXHAUST OR RADIATION


This classic principle of physics requires little translation for the financial markets. Real trading opportunities look like opportunities because they emit characteristics of impending directional price movement. This reveals itself in crowd participation, price action at known boundaries, the creation of recurring price patterns, and the convergence of technical indicators. Interpret these diverse market signatures correctly and book consistent profits as a swing trader.

Engineers build machinery to investigate exhaust emissions and measure their internal characteristics. For example, a hose attached to a vehicle's exhaust pipe tells the auto mechanic the current condition of the internal machinery. Swing traders build similar measurement tools to evaluate the state of internal market activity. But just as the engineer designs instruments to examine a very narrow range of physical information, swing traders must limit data intake to specific market characteristics and filter out many noise levels that can defeat profits.

Chart patterns with true predictive power emit evidence that these market engineers can detect and measure. The radiation of opportunity builds through convergence of diverse elements at narrow intersections of price and time. Each independent signal drawn into this small space raises the odds that a trade setup will produce a valid result. Heat builds strongly at these important levels and tells the swing trader to get on board quickly.

Reading the Charting Landscape: Highly predictive charts print well-organized patterns at expected price levels. AMCC starts with an Island Reversal (1) that ends a clear Elliott 5-Wave (2) rally. Price drops under the intermediate high at 48 and the 62% retracement (3) of the prior move. Weak congestion (4) forms under the retracement level. The bottom Bollinger Band (5) expands downward, opening the door to falling price. All signs points to an impending first failure event (6), in which price will retrace 100% or more of a prior trend leg. The swing trader measures this evidence, sells short into the congestion, and waits for the pattern to work out the expected result.
CONCLUSION


Modern traders have great difficulty organizing market movement into a manageable feedback and execution system. Too often, they ignore important chart data because it doesn't fit into a convenient system of horizontal price boundaries. This obsession with simple-minded pattern recognition exposes a trader's inability to grasp the more powerful mechanics of price prediction. Unfortunately, concentrating on a narrow execution strategy is like trying to play music with a single note. It works only when a fleeting moment of opportunity demands a single, flat tone.

Expand your trading knowledge through the application of market physics. Each new aspect expands your ability to profit from subtle aspects of crowd behavior. Keep in mind that these natural forces rely upon mechanics that many speculators will overlook. This lets you gain an important edge on the path to successful trading. It might take a lifetime to explore these complex interactions between evolving price and the emotional crowd. But each piece of this fascinating puzzle adds new levels of empowerment to trading performance. 

http://jodnet.blogspot.com
read moor ,,,

| 0 التعليقات ]

Bilateral Trade Setups 


When it comes to trade setups, it's not always an either-or situation. In fact, you can double your fun with bilateral trade setups.

Start by overcoming directional bias when you look at a price pattern. Although you may see it in your mind as a long or a short, chances are it will work in either direction. The trick is to let the price action tell you which way to go.

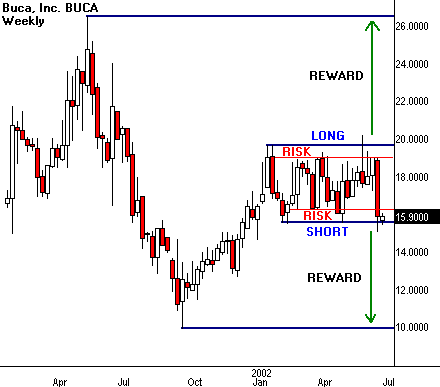
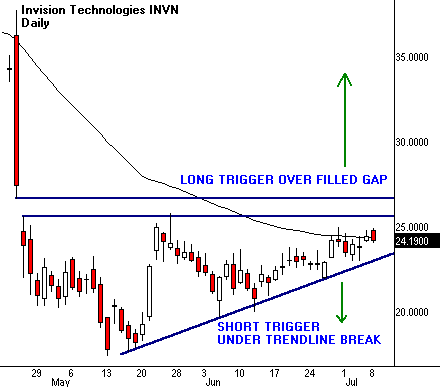
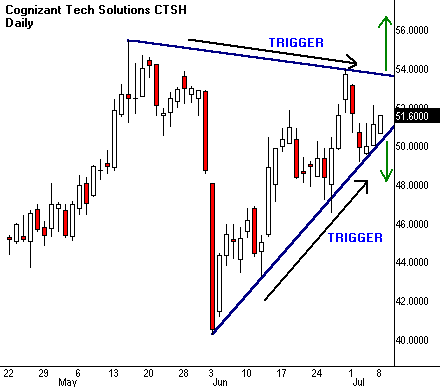
Let's back up a step and see how this works. Many patterns exhibit well-defined support and resistance. Bilateral setups use both levels for trade execution. A long entry is signaled if price breaks resistance to the upside. Conversely, a short sale is signaled if price breaks support to the downside. But you still have more work to do before taking a bilateral trade. After all, making money is the whole point of the exercise.

Every trade setup generates a unique reward/risk profile. In other words, it tells you how much you stand to win or lose should you decide to take a position. Each side of a bilateral setup carries a different reward/risk ratio. Most of the time, one side shows more profit potential than the other side. This can be frustrating because the calculation is independent of the odds that either outcome will actually take place. So you may have a great, high-odds setup with little or no reward, or a lousy, low-odds setup that would earn a fortune if it ever happens.

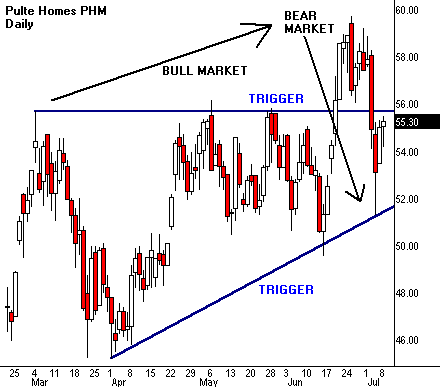
The price trigger complicates bilateral trade entry. Trading signals come in all varieties. The best ones ring very loud bells within very narrow price levels. One classic example is a high-volume breakout through a major moving average. Bilateral strategies force you to locate trigger prices on both sides of the pattern. Many times one side will bark much louder than the other when price hits the associated trigger. 


Bilateral setups work best when they fit into larger cycles that encourage price movement in either direction. For example, a stock drops off a broad rally into an extended correction. Smaller patterns within this correction may trigger short-term rallies or selloffs. Bilateral strategy lets the trader take advantage of the mixed environment and execute price swings in both directions.

Let's review the signposts of this two-way trading street. We need well-defined support-resistance levels, a defined reward/risk ratio on both sides of the equation, clean price triggers and a big picture that lets us execute in either direction. Sounds simple enough, and it is.

The difficulty lies in our ability to control bias and to let the market tell us which way to go. Very often the best trade is in the opposite direction from the most obvious outcome for that pattern. In other words, the majority piles in one way, but the profit comes from trading it the other way.

The good news about these fascinating patterns is they may tell you when the move is about to happen. Congestion often narrows toward a trigger point. We see this in triangle patterns where two trendlines converge in price and time. Bilateral setups may show this convergence through simple lines, or sometimes through more complicated volatility cycles.

Volatility drops off through the formation of most bilateral patterns. It tends to reach a definable low, and then trigger a sharp price expansion. Traders examine narrow range price bars near support or resistance levels in order to predict impending price triggers. They also study classic volatility indicators to locate these turning points in developing patterns.

Swing traders go long or short, depending on the opportunity. Bilateral setups cut their workloads by presenting two possible trades in a single pattern. So always look at both sides of the equation when examining a price chart. Then leave your bias at the door, and take whatever the market gives you. 

http://jodnet.blogspot.com
read moor ,,,

| 0 التعليقات ]

Adam and Eve Tops 


Stock charts print many unique topping formations. Some classics, such as the Descending Triangle, can be understood and traded with very little effort. But the emotional crowd also generates many undependable patterns as greed slowly evolves into mindless fear. Complex Rising Wedges will defy a technician's best effort at prediction while the odd Diamond pattern burns trading capital swinging randomly back and forth.
Skilled traders avoid these fruitless positions and only seek profit where the odds strongly favor their play. They first locate a common feature found in most topping reversals: price draws at least one lower high within the broad congestion before violating a major uptrend. This common double top mechanism becomes the focus for their trade entry. From this well-marked signpost, they follow price to a natural breaking point and enter when violated. 

Do you recall the Adam & Eve Bottom, featured earlier in this column? This unique formation consists of a spiking first bottom, followed by a rounded second one. Flip the pattern over and you'll find a highly predictive structure for trading these topping reversals.
This simple Adam & Eve Top provides traders with frequent high profit short sales opportunities. Note this classic pattern in Quantum's chart. Price never drew a third high before entering a significant bear market. Successful A&E short sales can be entered on the first violation of the reaction low, regardless of an underlying trend. However, use tight stops to avoid "turtle reversals". These occur when sharp short covering rallies suddenly erupt right after the gunning of stops below a violation point.
Each uptrend generates positive sentiment that must be overcome through the topping structure. A&E tops represent an efficient bar structure to accomplish this task. The violent reversal of Adam first awakens fear. Then the slow dome of Eve absorbs the remaining bull impulse while dissipating volatility needed to resume a rally. As the dome completes, price moves swiftly to lower levels without substantial resistance.
Observant technicians will recognize the mechanics of Descending Triangles and Adam & Eve formations in more complex reversals. The vast majority of tops contain some characteristics of these familiar patterns. Crowd enthusiasm must be eliminated for a decline to proceed. Through the repeated failure of price to achieve new highs, buying interest eventually recedes. Then the market can finally drop from its own weight.
QNTM
Quantum's 1997 multi-year high breaks down in a dramatic Adam and Eve Top. Look for both volume and volatility readings to decline gradually through the formation of the second rounded high. Most times, this "Eve" consumes more price bars than the "Adam" that precedes it.       
read moor ,,,

| 0 التعليقات ]


AmiBroker 5.30


Featuring automatic Walk-Forward Testing, Multi-monitor floating charts, symbol and
interval linking, drag-and-drop indicator creation, Industry fastest, Unlimited-symbol True Portfolio-Level Backtesting and Optimization, now with Smart Evolutionary algorithms, scaling, market-neutral system support and multiple currency handling, free Fundamental data, Multiple Time-Frame support, 3D optimization charts, new Account manager, 
automated trading interface, volume profile, object-oriented charting, drawing layers, multi-window layouts, formula-based alerts, easy-to-use formula editor, equity function, unique composite indicators, built-in web research browser, direct link to eSignal, Interactive Brokers, IQFeed, myTrack, FastTrack, QP2, TC2000, any DDE compliant feed, MS


Stock charting and analysis program, trialware, 32-bit Windows version. Works on both 32- and 64- bit Windows.
Universal installer for BOTH Standard and Professional versions.


File
Version
Release date
Size
Platform
Description
NEW!
AmiBroker 5.30
5.30

(5.30.4.5108)
July 23, 2010
7MB
(7,936,600)
Windows 7,
Windows Vista,
Windows XP,
Windows 2000,
Windows Me,
Windows NT,
Windows 9x
NEW AmiBroker 5.30 Official Release,
Standard & Professional Editions,
Full setup with program, help and example files.
Self-Extracting EXE
.
This universal installer supports:
  • full installation
    (both registered and trial)
  • upgrade installation


Automated Trading Interface for Interactive Brokers and AmiBroker 4.80 or higher, FREE SOFTWARE, 32-bit Windows version. This software is an add-on to AmiBroker (see above)

File
Version
Release date
Size
Alternative sites
Description
NEW!
AutoTrading Interface
1.3.8 BETA
August 10, 2010
56KB
IBController 1.3.8
Self-extracting archive.
Requires AmiBroker to be installed first.
More information:
http://www.amibroker.com/at/

miBroker User's Guide in PDF format:
IMPORTANT: The User's Guide is INCLUDED in the full setup package in the HTML Help format. It is accessible by pressing F1 (Help) key in AmiBroker, it is browsable and has a search and index features. You should use that help file, not the PDF below.
For sole purpose of printing (if you need hard copy for some reason), the PDF-converted version is provided here:

 AmiBroker Development Kit
The AmiBroker Developlent Kit (ADK) is a package for C/C++ developers allowing to develop own indicator and/or data plugin DLLs.
File
Version
Release date
Size
Description
2.10a
August 4, 2010
557KB
(self-extracing exe)
AmiBroker Development Kit (ADK)
includes headers, C/C++ samples for custom indicator and data DLLs. Self-extracting exe file.
2.10a
August 4, 2010
531KB
(plain zip file)
AmiBroker Development Kit (ADK)
includes headers, C/C++ samples for custom indicator and data DLLs. Plan zip file.
AmiQuote
Internet stock downloader program - companion to AmiBroker, trialware, 32-bit Windows version.
If you are using Windows 95, Internet Explorer 4 or higher must be installed. Find out more
File
Version
Release date
Size
Alternative sites
Description
2.13
Aug 23, 2010
94KB
AmiQuote 2.13
Self-extracting archive.
Now supports Yahoo, Yahoo Fundamentals, Google Finance (NEW), MSN Money Central and Forex.

Fundamental data import feature requires AmiBroker 4.81 or higher.


AFL Code Wizard

Automatic AFL formula creation program - specify your formula in plain English and program will write the formula for you - companion to AmiBroker, trialware, 32-bit Windows version.
If you are using Windows 95, Internet Explorer 5 or higher must be installed. Find out more
File
Version
Release date
Size
Alternative sites
Description
AFL Code Wizard trial is included in the AmiBroker 5.30 setup (above).
To install it, simply install AmiBroker 5.30.
URLGet
Script utility downloader program - freeware, 32-bit Windows version.
If you are using Windows 95, Internet Explorer 4 or higher must be installed. Find out more
File
Version
Release date
Size
Alternative sites
Description
URLGet 1.0
1.00
January 7, 2001
5KB
URLGet 1.0, English version.
(No setup required if AmiBroker is already installed - just unzip the archive).
SSL Add-on for AmiBroker 5.21 and higher
File
Version
Release date
Size
Alternative sites
Description
SSLAddOn.exe
1.00a
Mar 31, 2010
343KB
The SSL Add-On for AmiBroker 5.21 or higher allows sending e-mail alerts to SMTP servers requiring SSL (secure) connection

http://jodnet.blogspot.com
read moor ,,,

Related Posts with Thumbnails